Execute and monitor a workflow
Start a run from a saved plan, follow its activities, and inspect the result. AkôFlow keeps the plan's predictions beside the run's observations so you can compare them when the runtime reports enough data.
For the API commands on this page, complete API connection setup first.
Choose real execution or simulation
- Real runs send activities to resources configured for execution, such as the local machine, Kubernetes, or SLURM.
- Simulation runs evaluate a workflow with a simulation environment such as SimGrid.
To open a terminal on one resource, follow the interactive console guide. Terminal sessions also appear in the run history, but they do not start from a workflow plan.
Status and timing
A submitted execution first enters the queue. When AkôFlow starts it, the workflow run becomes running, then completed or failed. The current supervisor records activities as running, completed, or failed; other task states exist in the model but are not a normal progression to wait for.
For real runs, submitted time marks when AkôFlow handed work to the runtime; started time marks when the runtime allocated it; container-started time marks when user code could begin inside the container.
The persisted run projection, audit trail, and provenance entities record the supervisor state. Treat the run status as authoritative when comparing Desktop and API responses: both surfaces read the same supervisor state.
Depending on the runtime and available observations, the completed trace can include:
- makespan and cost;
- compute, transfer, queue, interference, and overhead time;
- activity placement and runtime job identifiers;
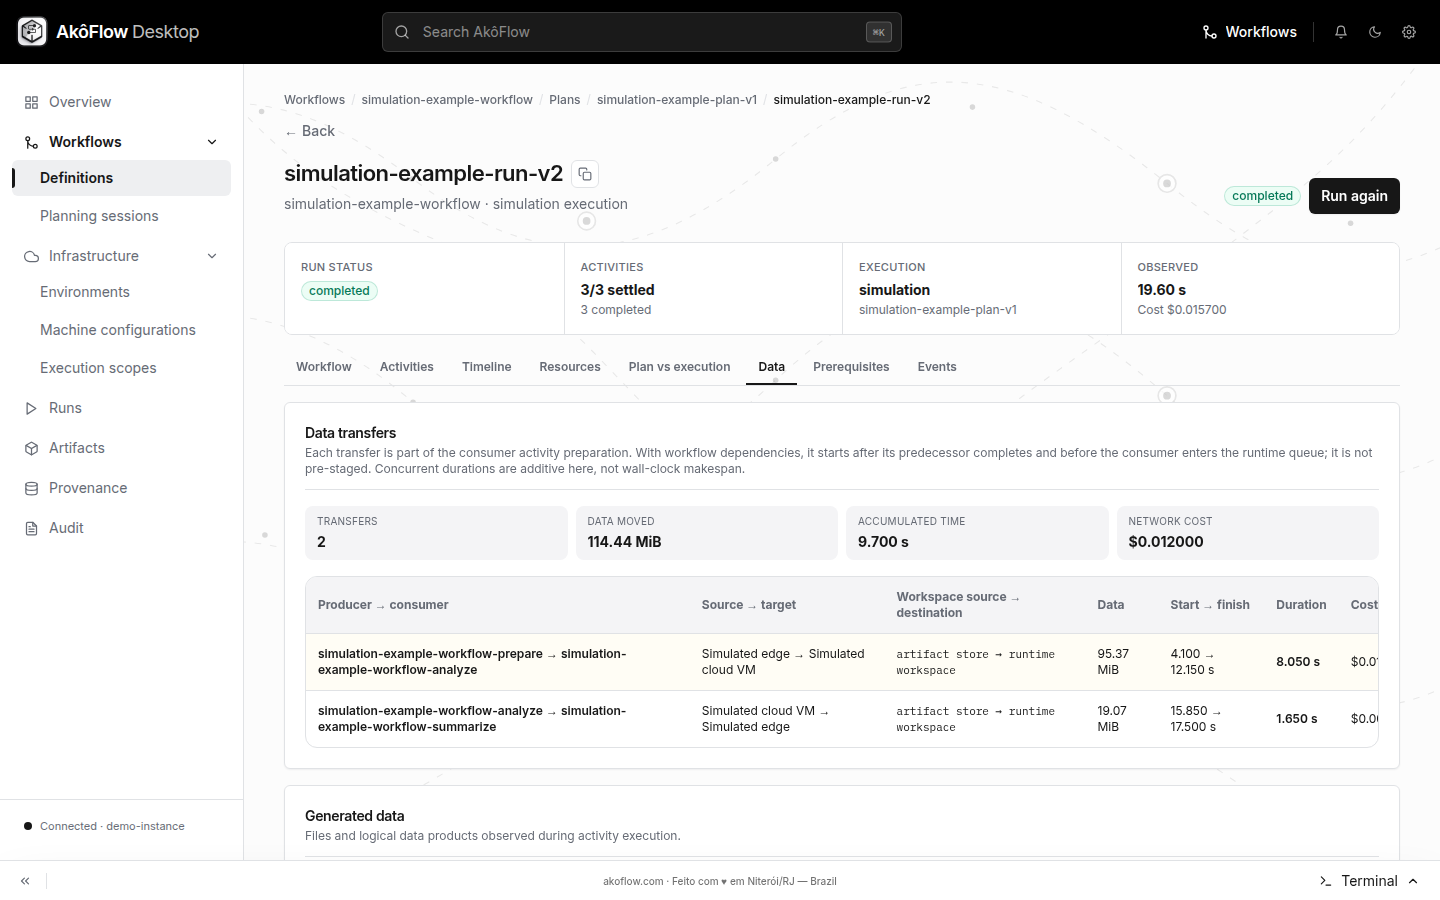
- transferred bytes, transfer duration/cost, strategy, and route;
- observed task intervals alongside predicted assignments.
Using AkôFlow Desktop
- Open a selected or manually created schedule plan.
- Choose the action to run it.
- Confirm the generated run ID and review the predicted allocation timeline. The mode is derived from the plan's execution scope: simulation scopes produce simulation runs; execution scopes produce real runs.
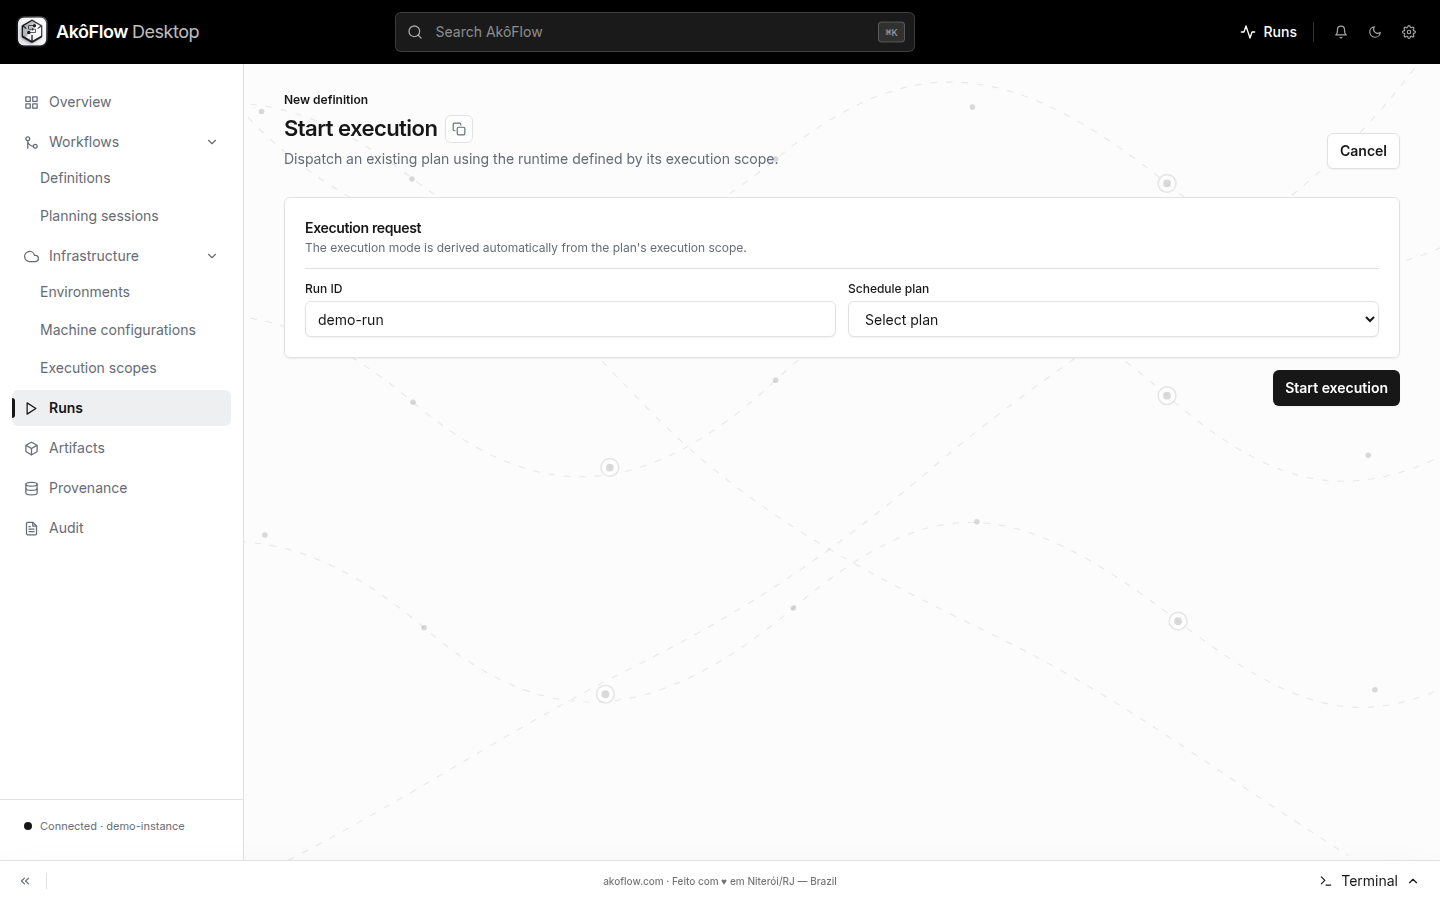
- Choose Start execution.
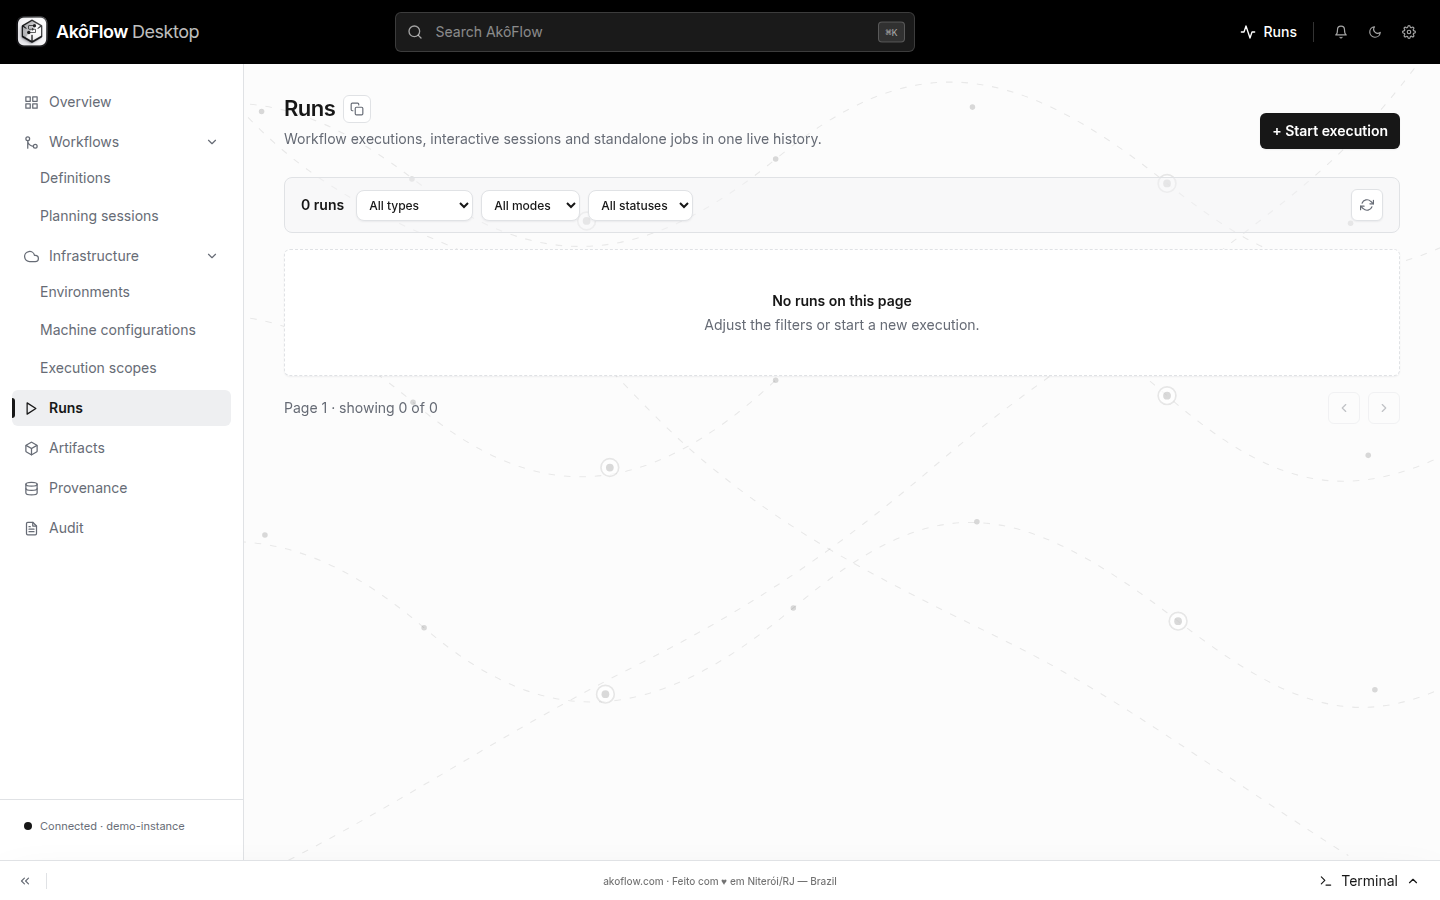
- Open Runs to follow the unified history. Filter by type, mode, or status.
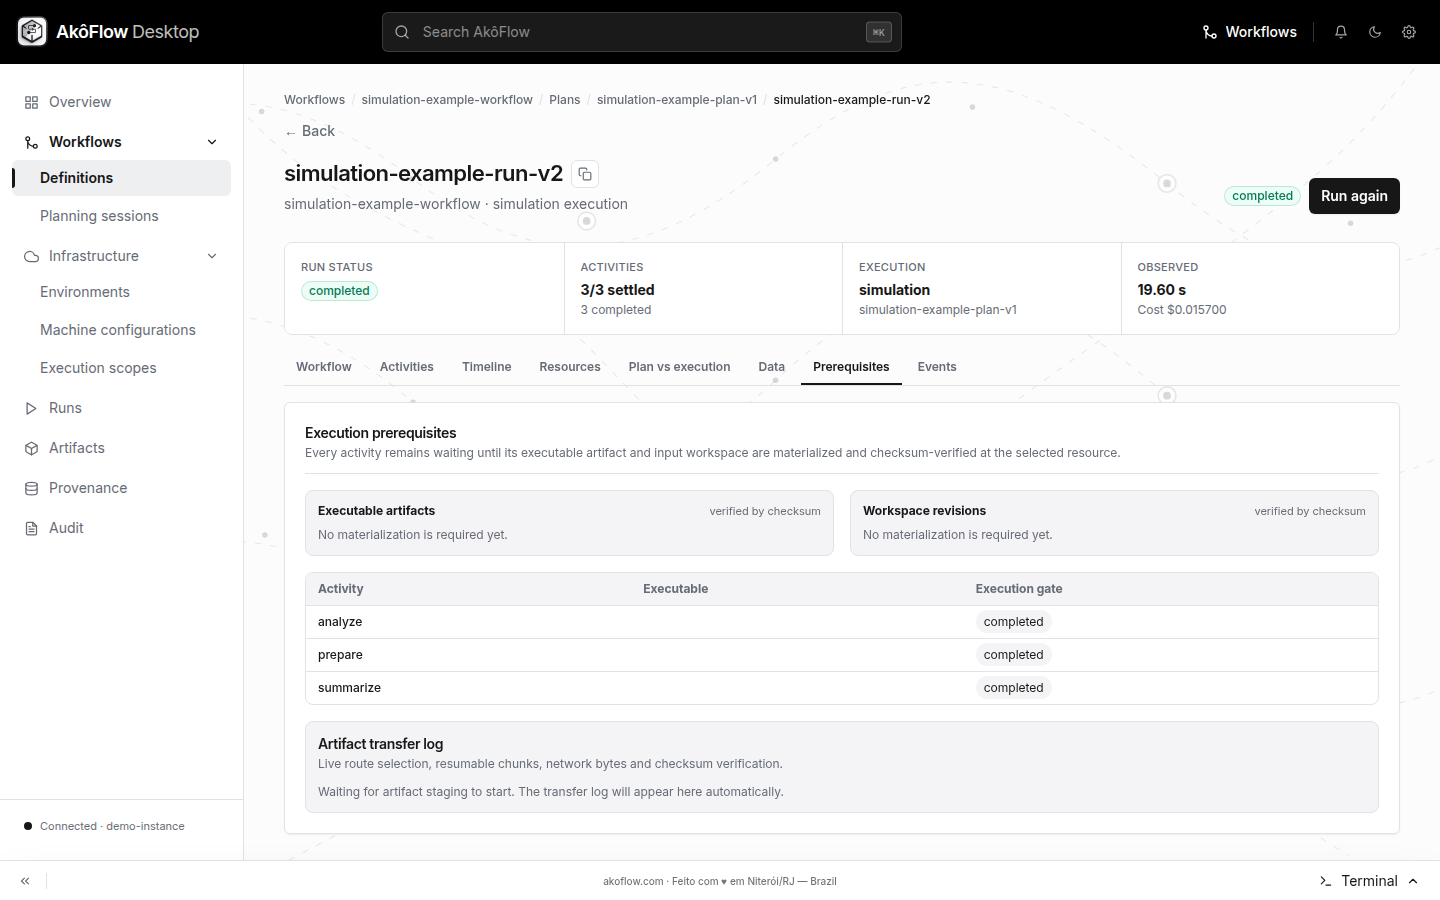
- Open the run to inspect live activity state, logs, placement, network transfers, and execution prerequisites.
- After completion, compare predicted and observed Gantt charts, per-activity runtime gaps, makespan, cost, and the execution-time decomposition.
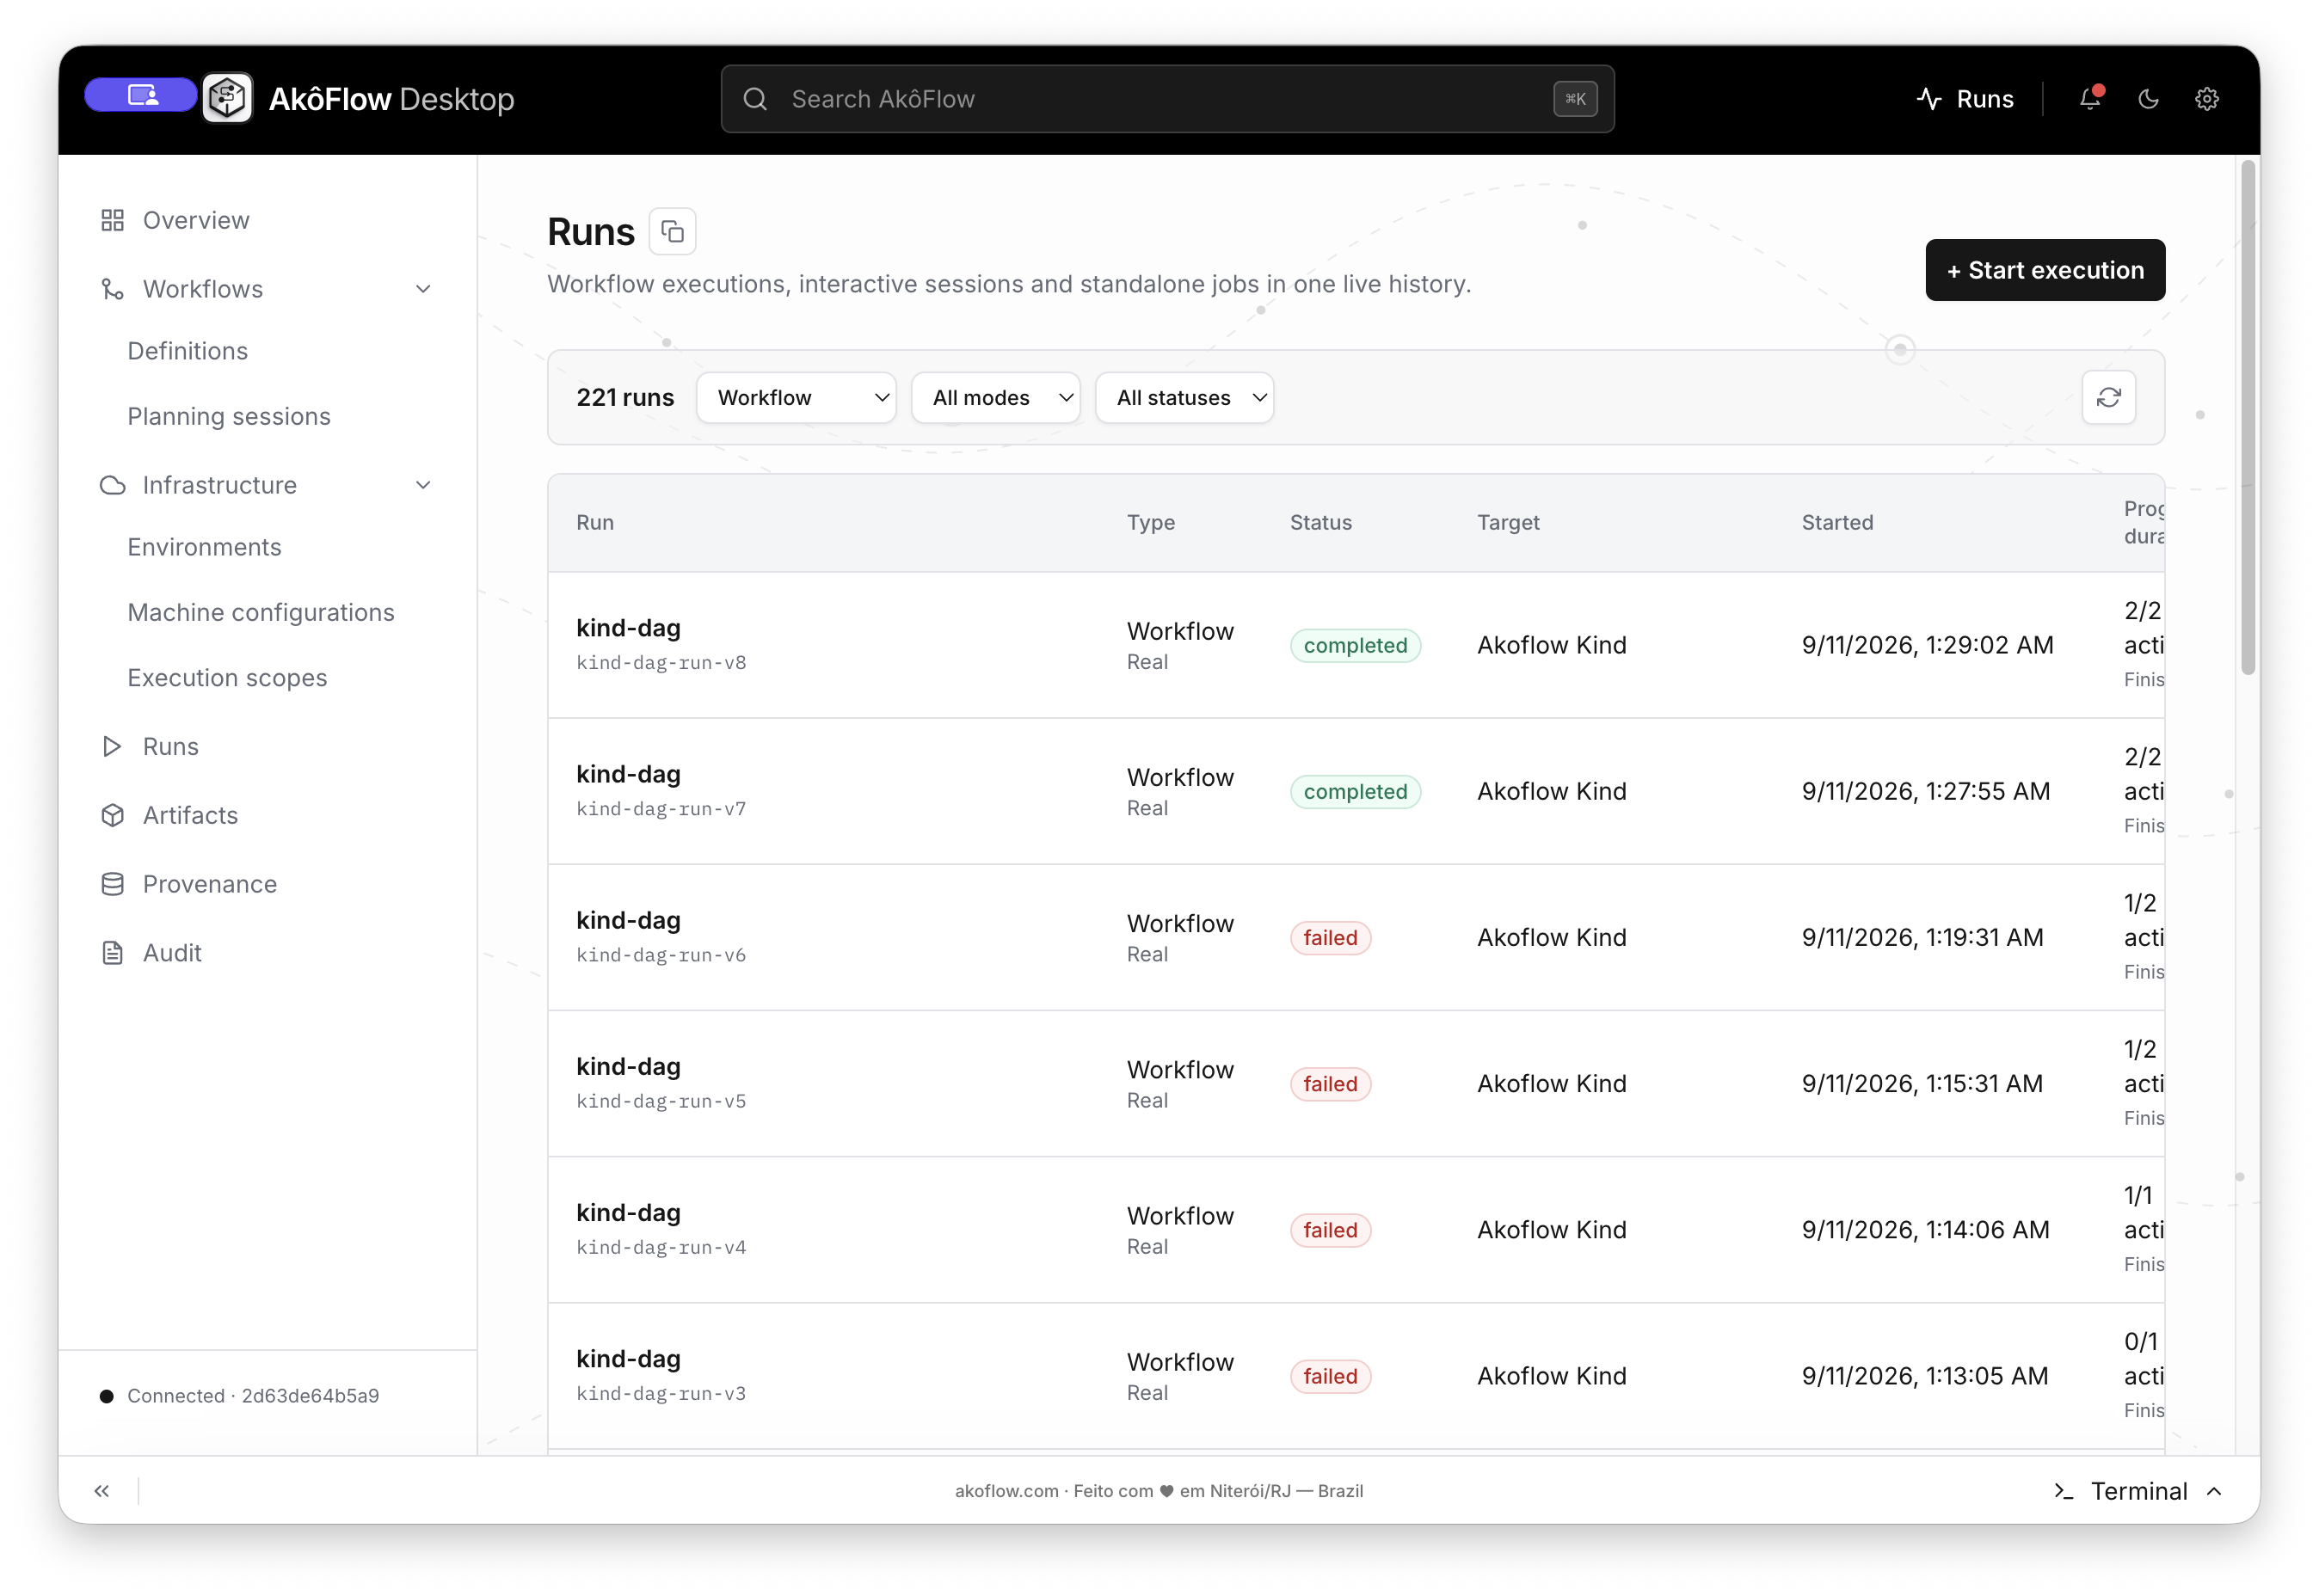
Start with the Type filter when investigating a workflow. The table then separates real and simulation runs, exposes the target and completion state, and reports activity progress. Select a row or Details to move from the compact history into the run evidence.
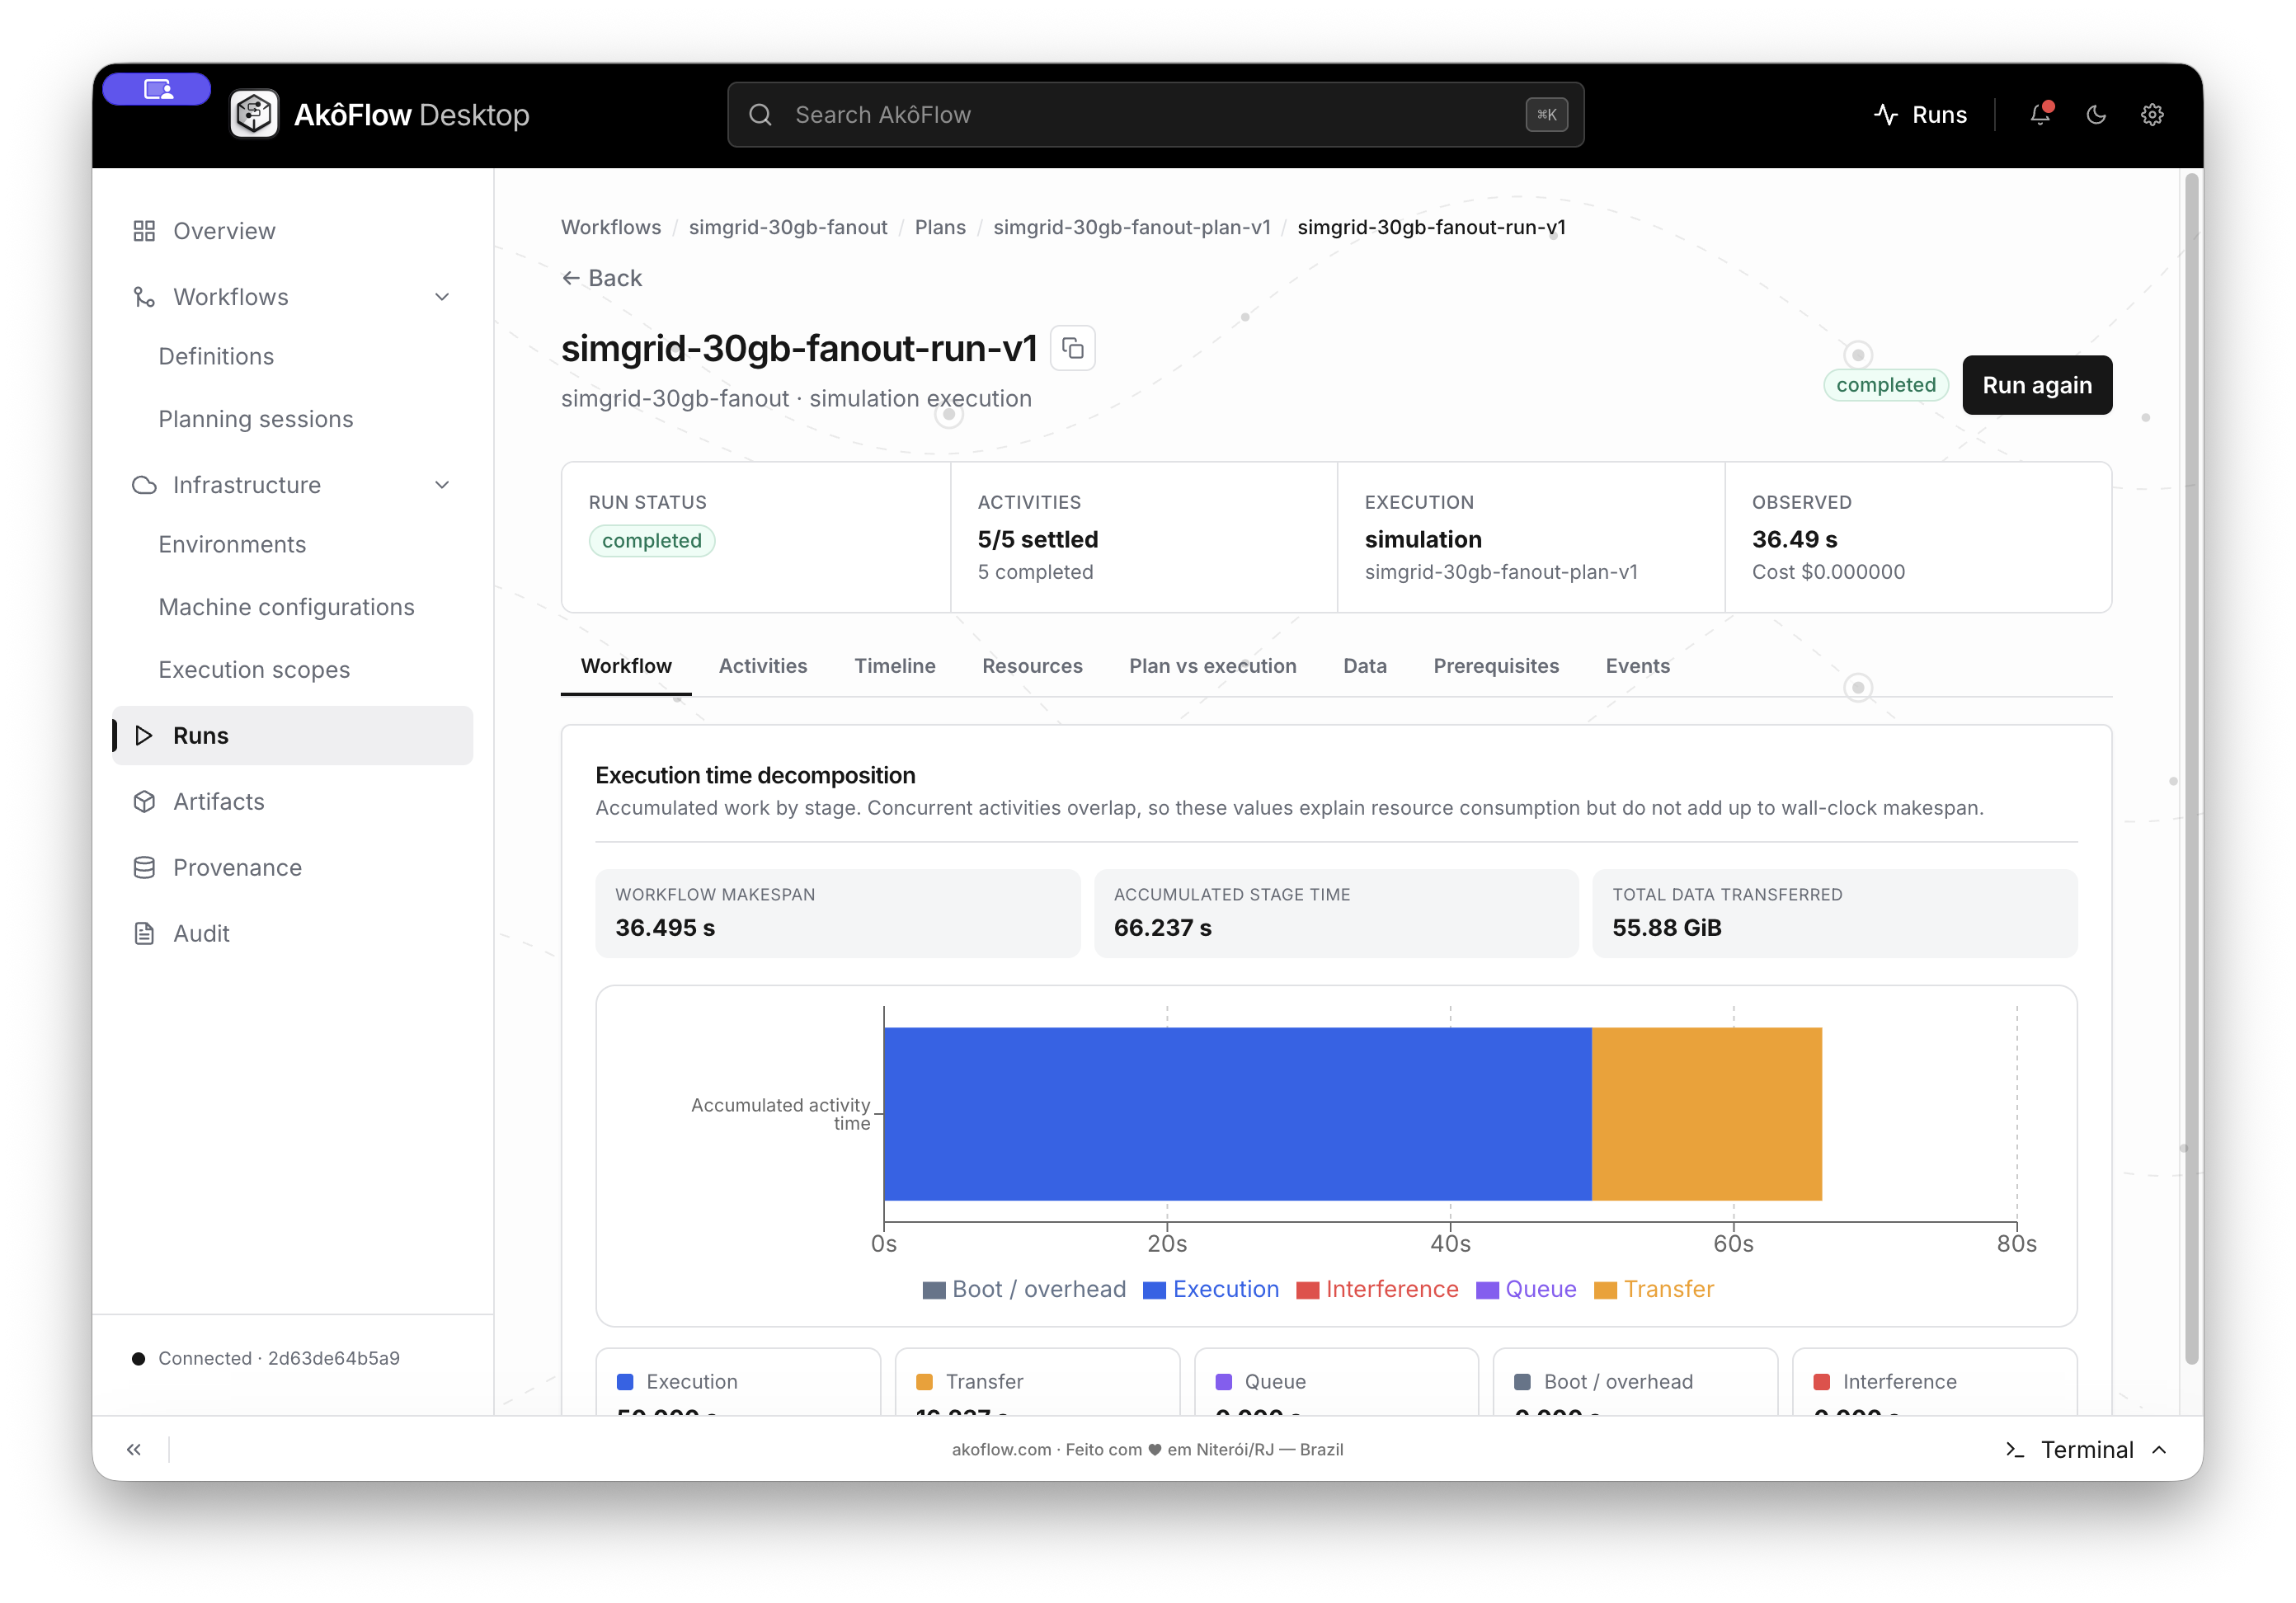
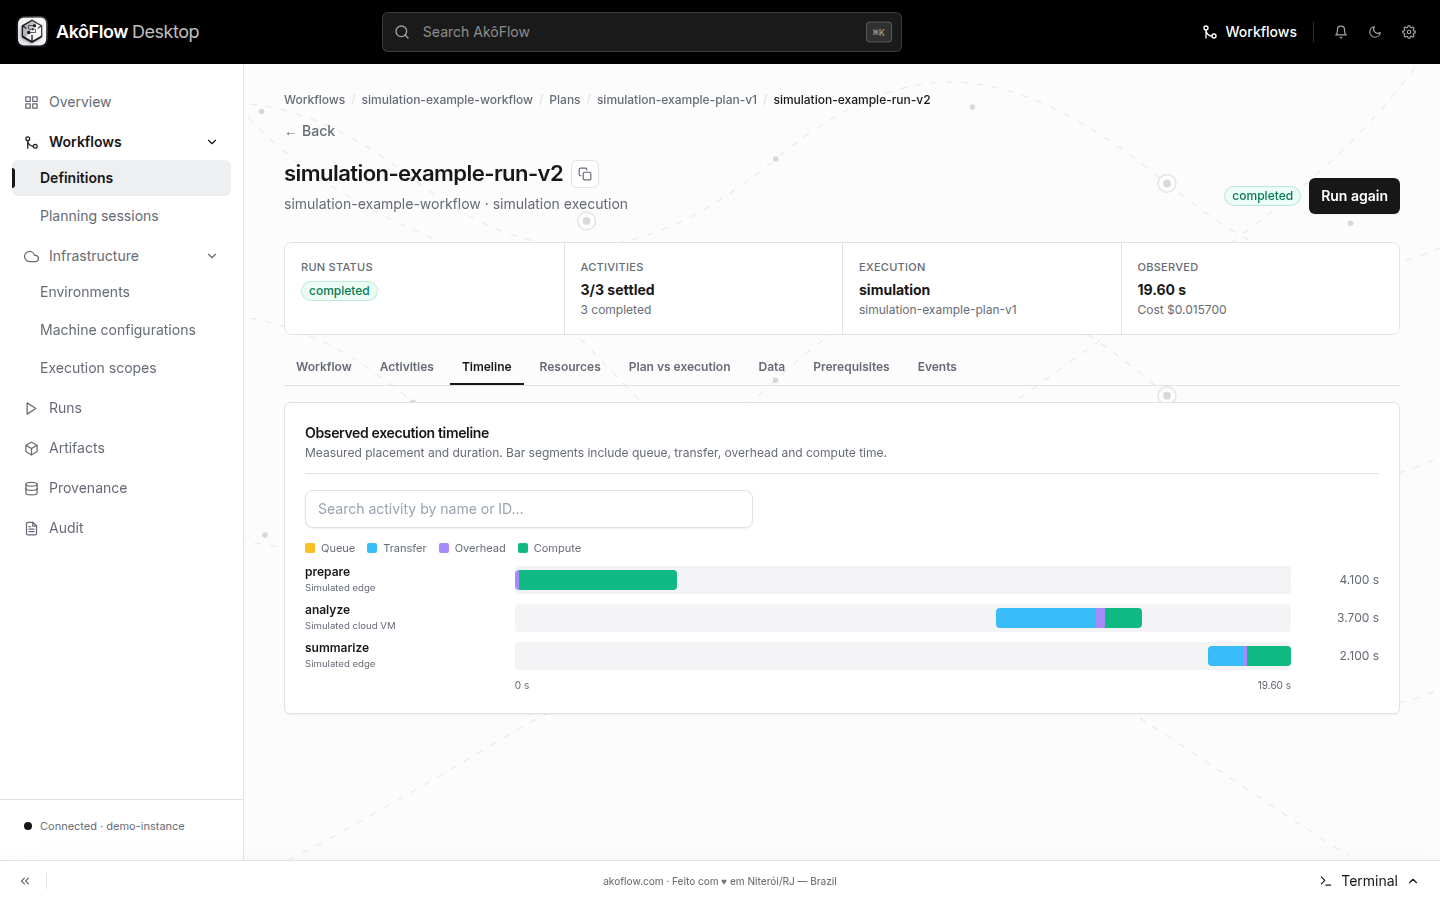
In the run detail, Workflow makespan is wall-clock completion time. Accumulated stage time is the sum of work attributed to stages across activities, so it can be greater than makespan when activities overlap. The decomposition makes transfer, execution, queue, boot and interference visible instead of treating them as a single unexplained duration.
Using the API
POST /execution-runs/ accepts a complete execution request. The command below assumes you have a repository checkout and have registered the environment, scope, topology, workflow, and plan in the SimGrid first-run tutorial. For Kubernetes, follow the Kubernetes infrastructure guide and use an execution request that targets its registered resources.
curl --fail-with-body \
  -H "Authorization: Bearer $AKOFLOW_API_TOKEN" \
  -H 'Content-Type: application/yaml' \
  --data-binary @akoflow-examples/simulation/execution-request.yaml \
  "$AKOFLOW_API_URL/execution-runs/"
This example submits the saved SimGrid plan with the workflow and environment it uses. The request reference lists the full payload. Submission returns 202 Accepted with a queued job; use the run.id from the example to read the run:
curl --fail-with-body -H "Authorization: Bearer $AKOFLOW_API_TOKEN" \
  "$AKOFLOW_API_URL/execution-runs/simulation-example-run-v1/"
A 404 immediately after submission can mean the queued request has not been
processed yet. Retry after a short wait. If the run never appears, check the
server log and the complete request: worker validation happens before the run
is saved, so an invalid queued request can fail without a run record.
The detail response contains run, activities, dataTransfers, handles, and events. It can also include infrastructure operations and saved data or artifact preparation records when those services are configured. List endpoints support the Desktop's run history and filters:
curl --fail-with-body -H "Authorization: Bearer $AKOFLOW_API_TOKEN" \
  "$AKOFLOW_API_URL/execution-runs/"
Investigating a failure
Start with run.failureReason, then inspect the failed activity, its handle failure, exit code and log, and the ordered run events. If failure happened during preparation, inspect executable/workspace preparation and transfer records; a runtime log may not exist yet.
Read an execution in Desktop
The run catalog provides status, mode, target, start time, and activity progress. Start run creates a standalone execution after its plan and target are selected.
The run overview summarizes observed timing and status. Use the owned sections below it to investigate one dimension at a time.
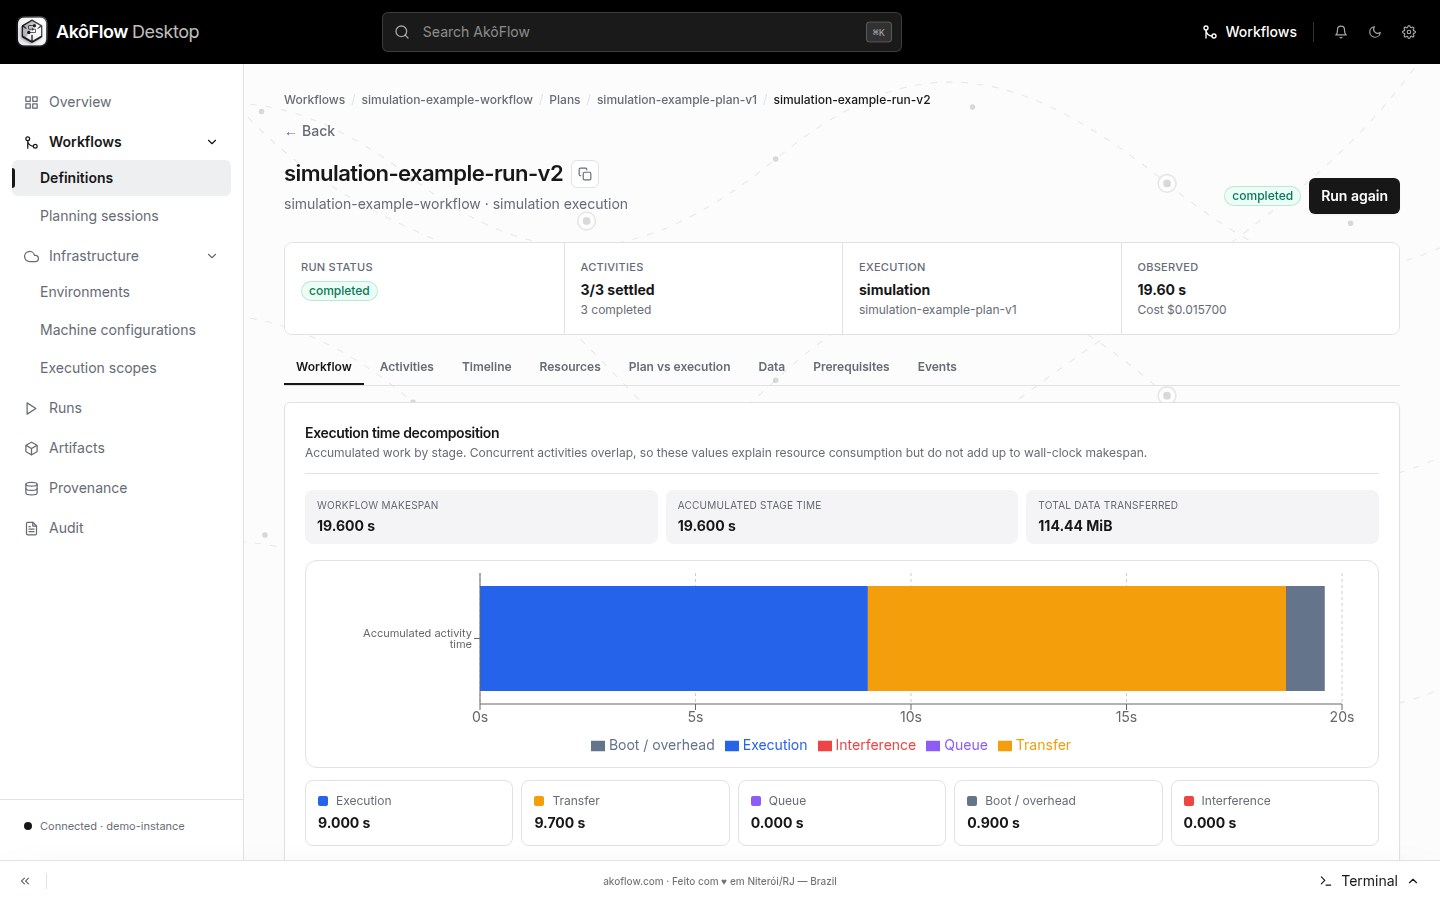
Activities exposes per-activity status; opening one activity reveals placement and measured time components.
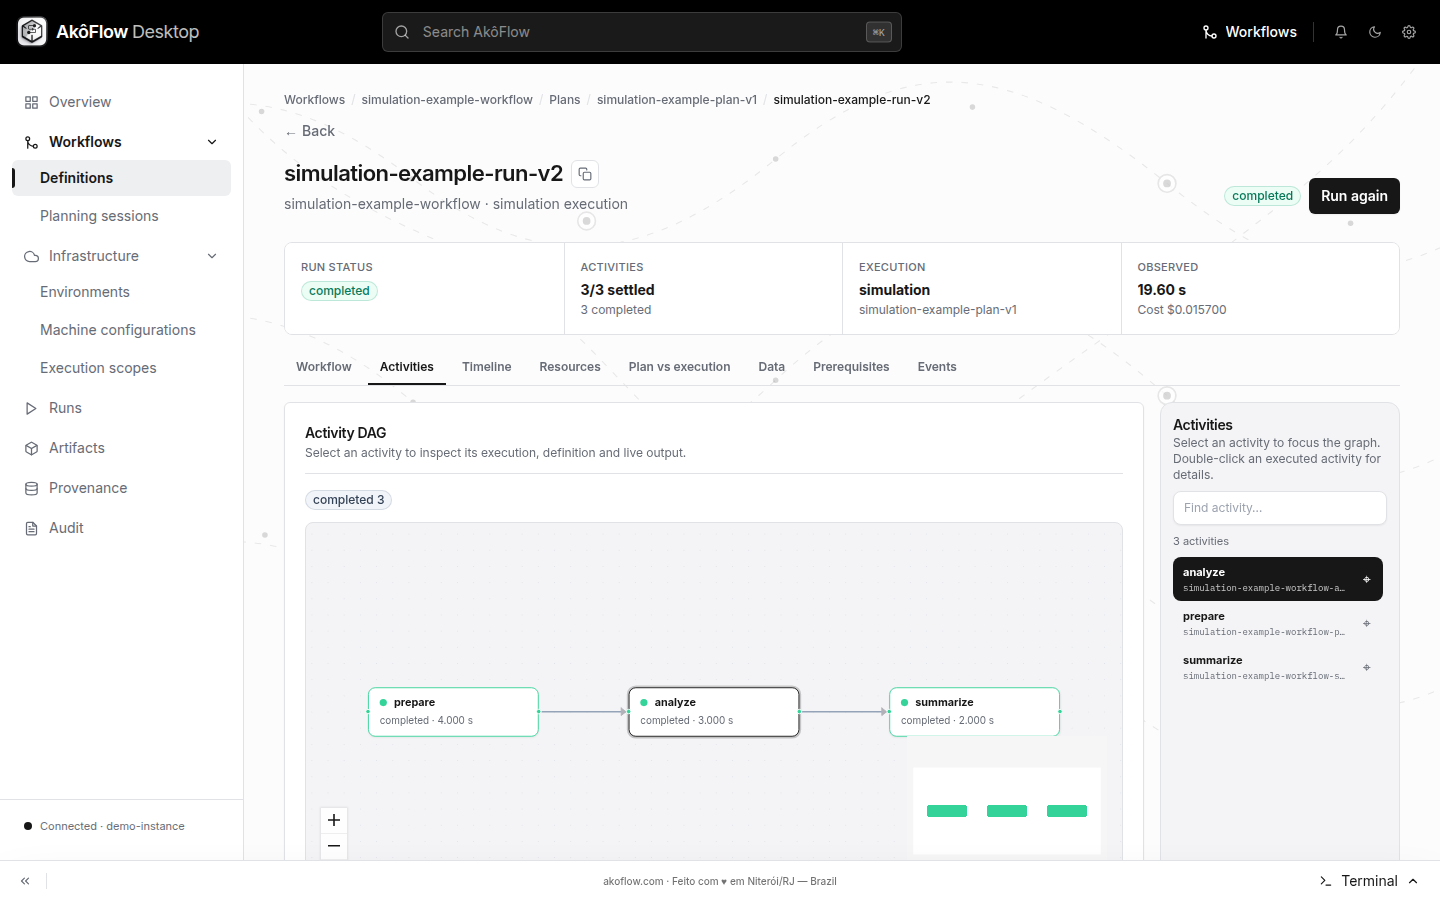
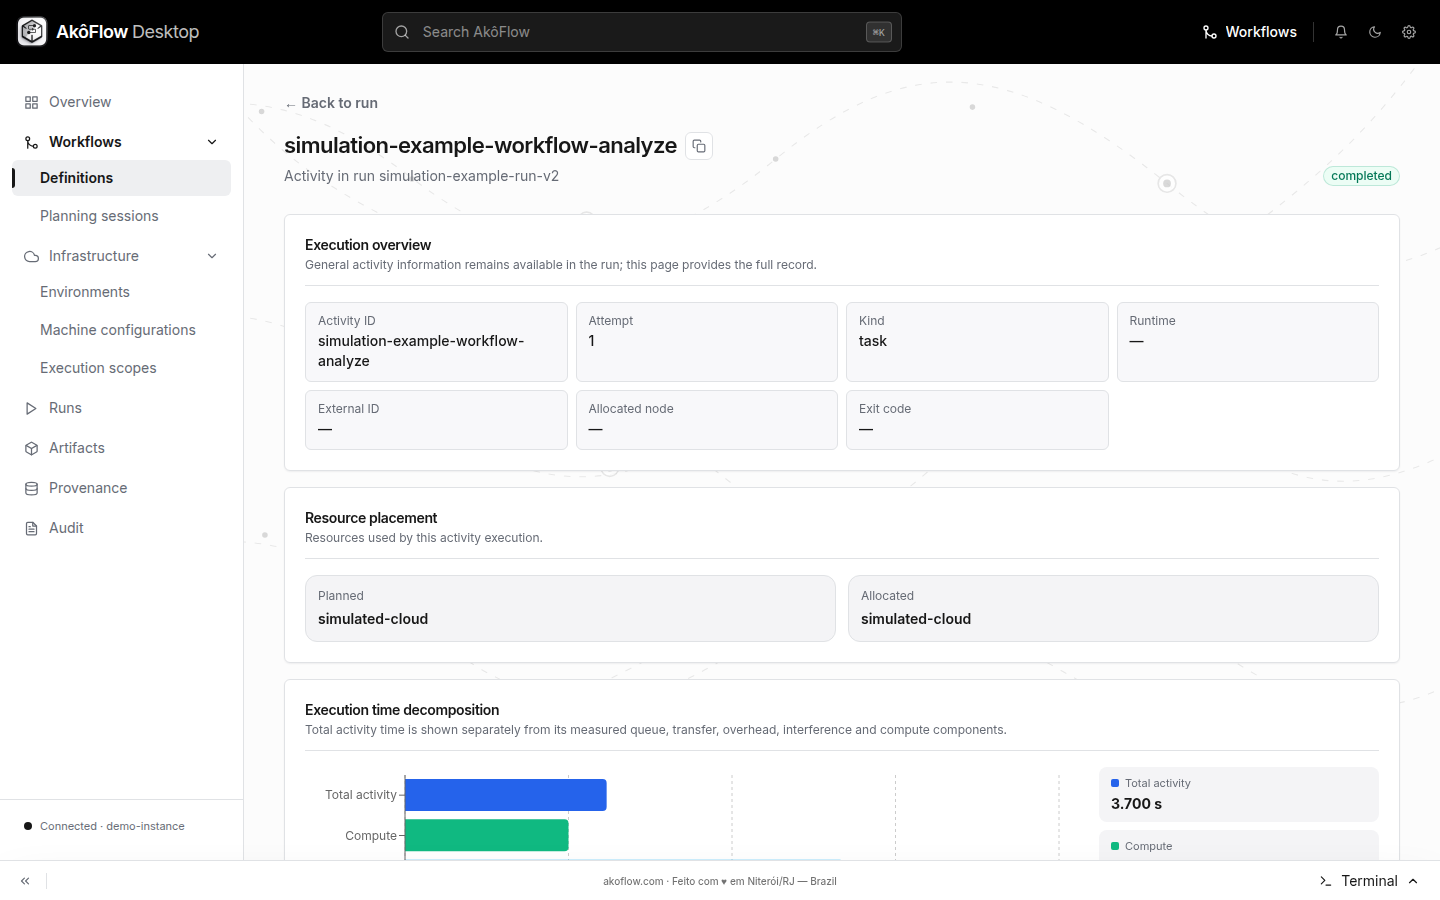
Timeline preserves ordering and overlap. Resources shows actual placement, and Plan comparison contrasts predicted and observed outcomes.
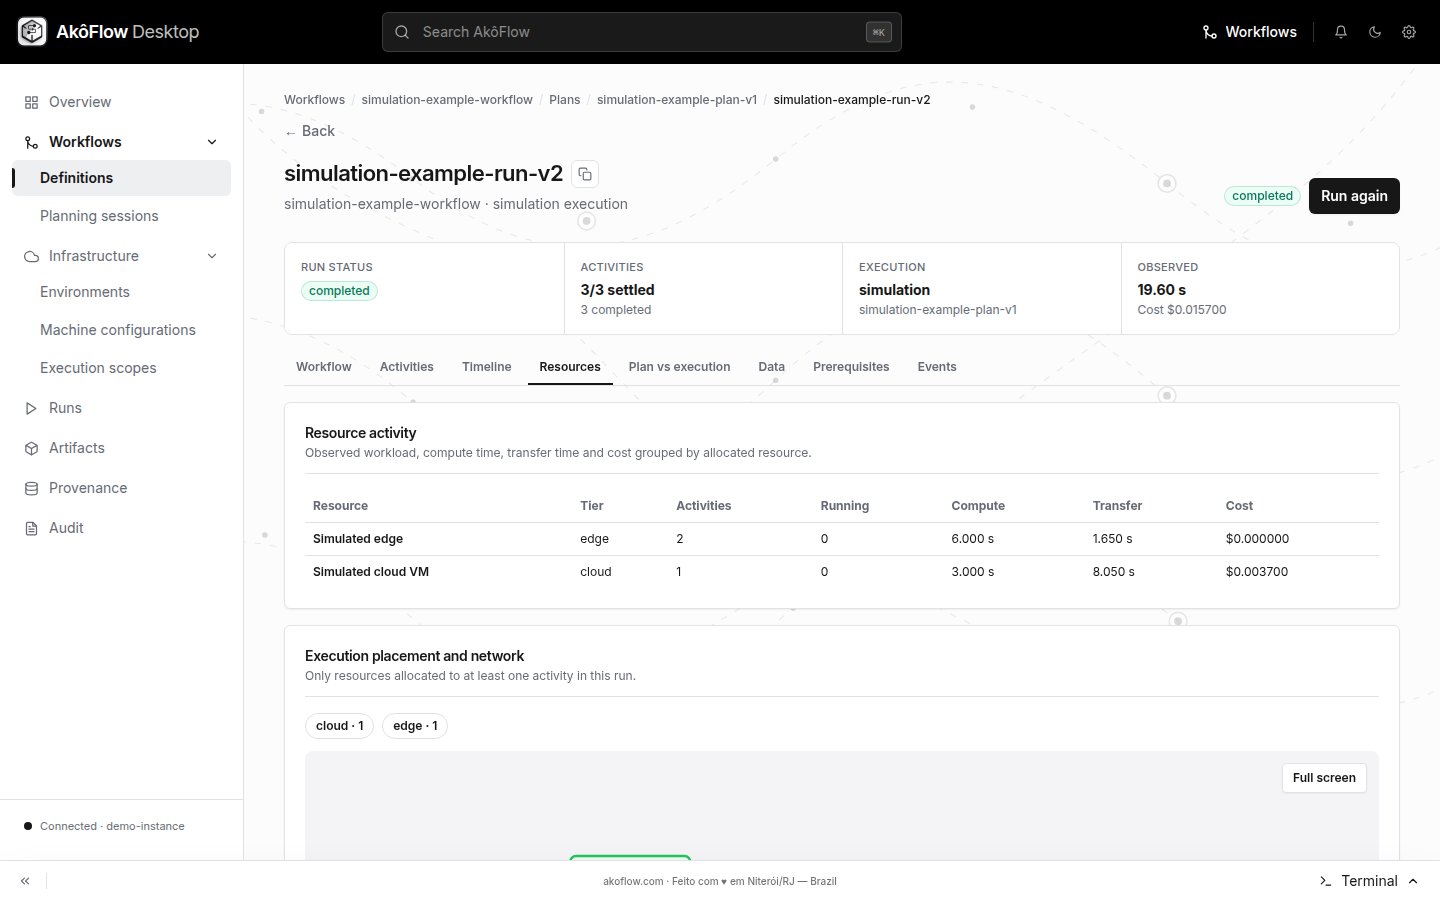
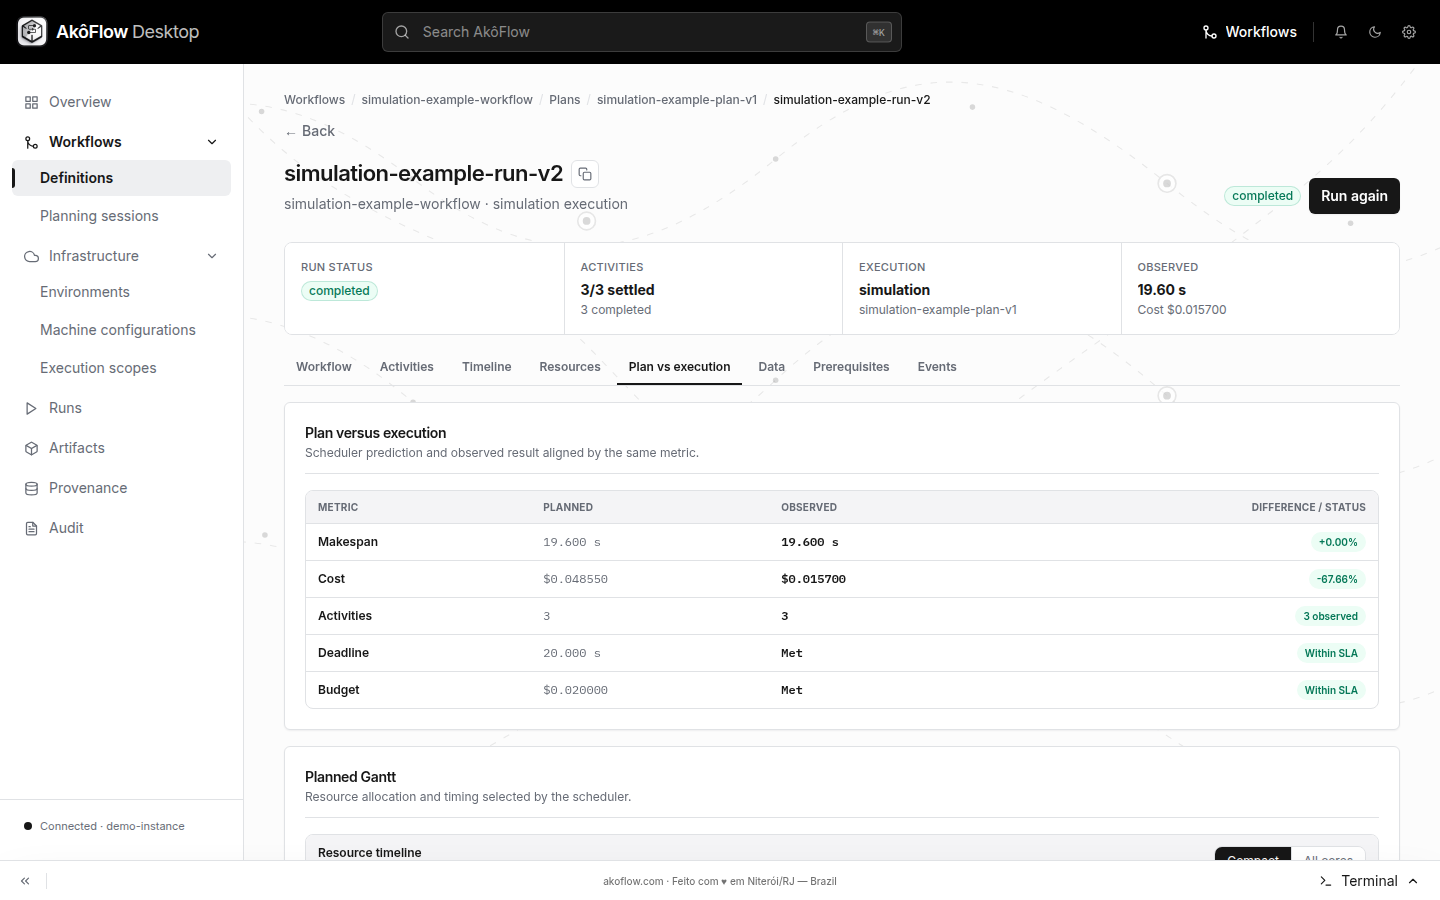
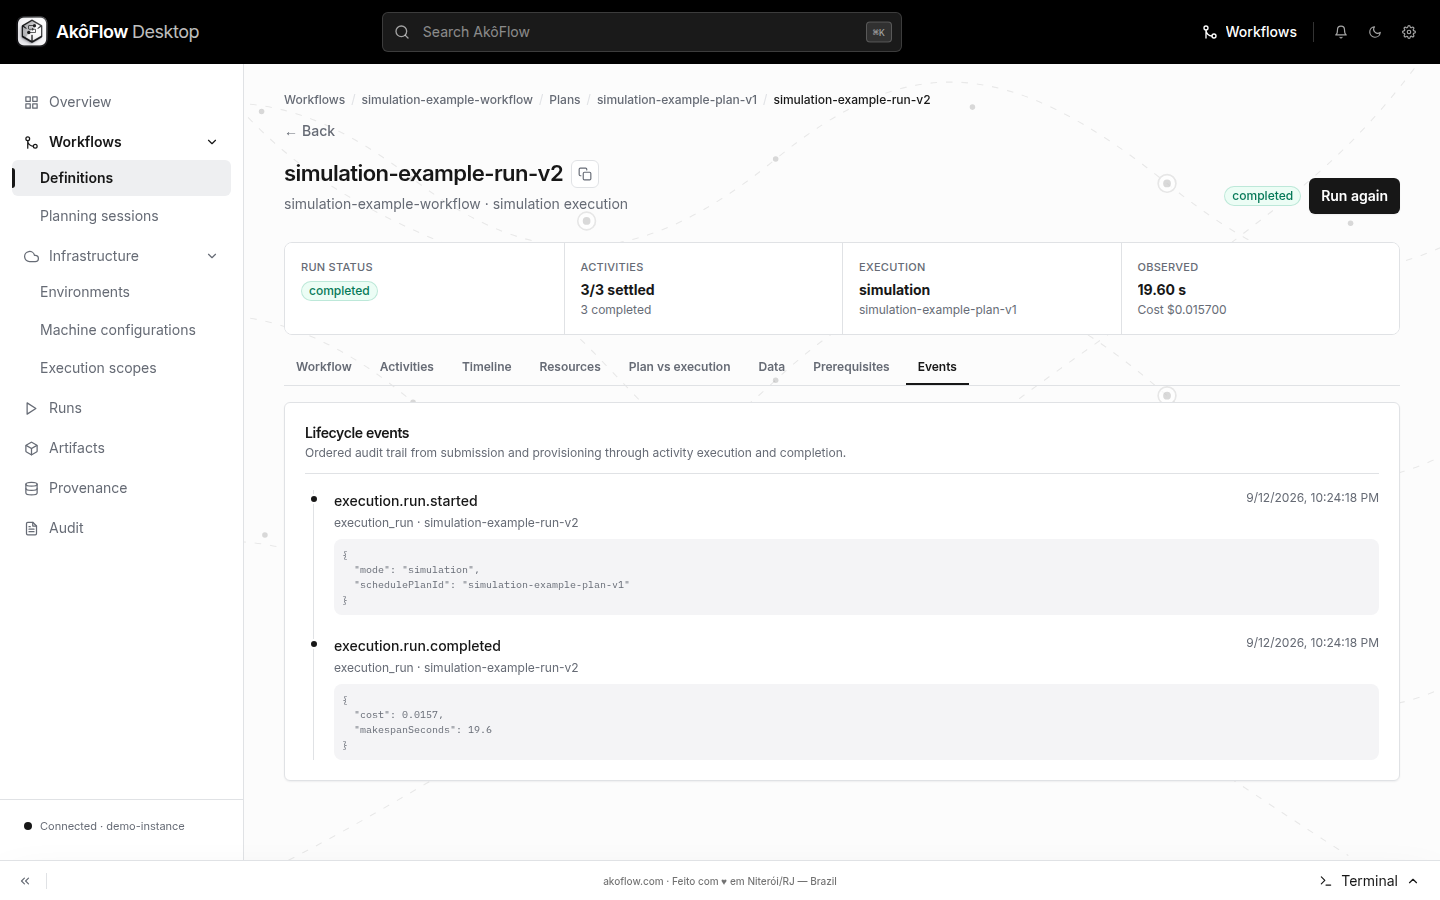
Use Data, Prerequisites, and Events when execution depends on transfers, preparation, or lifecycle transitions.